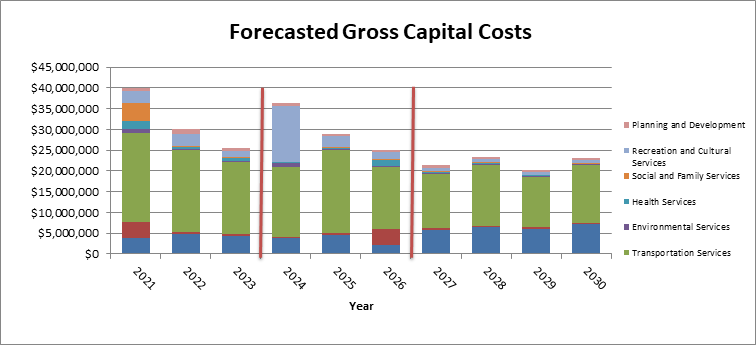
Here you will information on the Tax Supported Capital Budget, which pays for works on our existing infrastructure to maintain our current assets, new investments within the county or improvements on current assets.
Tax Supported Capital Budget
Budget Documents
| CAPITAL BUDGET | 2020 | 2020 | 2020 | 2021 | 2021 | 2021 |
| Tax Supported | Rate Supported | Combined | Tax Supported | Rate Supported | Combined | |
| Current Year Gross Expenditures | $37,091,350 | $13,277,120 | $50,368,470 | $40,088,280 | $7,146,300 | $47,234,580 |
| % of Total 10 Year Forecasted Expenditures | 15% | 11% | 14% | 15% | 6% | 12% |
| Total 10 Year Forecasted Expenditures | $246,426,820 | $116,488,420 | $362,915,240 | $274,523,330 | $127,488,000 | $402,011,330 |
| Average Gross Expenditures/Year | $24,642,682 | $11,648,842 | $36,291,524 | $27,452,333 | $12,748,800 | $40,201,133 |


